Scaling Up Rails Applications With PostgreSQL Table Partitioning - Part 3
After publishing recent blog posts about table partitioning - its SQL basics part and how to use in in Rails application I was asked quite a few times what is the real performance gain when using table partitioning. This is a great question, so let's answer it by performing some benchmarks.
Setting up data for benchmarking
As the table partitioning is intended to be used in Rails application, it makes most sense to perform benchmark with ActiveRecord's overhead as well - we want to have some real-world comparison.
In the two previous parts we were discussing orders example, so let's do the same here. We can start with generating model:
rails generate Order
For benchmarking use case without table partitioning we don't really need to change much, just add an index for created_at column:
class CreateOrders < ActiveRecord::Migration
  def change
    create_table :orders do |t|
      t.timestamps null: false
    end

    add_index :orders, :created_at
  end
end
In case of partitioning, however, we need to set up some extra tables. We can reuse the examples from part 2. Let's add the partitoned gem to the Gemfile:
gem 'activerecord-redshift-adapter',  git: "git@github.com:arp/activerecord-redshift-adapter.git", branch: "rails4-compatibility"
gem 'partitioned', git: "git@github.com:dkhofer/partitioned.git", branch: "rails-4-2"
And set up Order model with the base class for partitioning by year (all the details are explained in part 2):
class PartitionedByCreatedAtYearly < Partitioned::ByYearlyTimeField
  self.abstract_class = true

  def self.partition_time_field
    :created_at
  end

  partitioned do |partition|
    partition.index :id, unique: true
  end
end
class Order < PartitionedByCreatedAtYearly
end
Finally, we can set up the migration:
class CreateOrders < ActiveRecord::Migration
  def up
    create_table :orders do |t|
      t.timestamps null: false
    end

    add_index :orders, :created_at

    Order.create_infrastructure
    dates = Order.partition_generate_range(Date.today, Date.today + 4.year)
    Order.create_new_partition_tables(dates)
  end

  def down
    Order.delete_infrastructure
    drop_table :orders
  end
end
For sample data let's start with creating 1 million orders for every year from 2016 to 2020. This should be enough to make the tables moderately big for real-world example and perform some meaningful benchmarking. Here's the code to create these records with random date from given year:
[2016, 2017, 2018, 2019, 2020].each do |current_year|
  dates_range = Date.new(current_year, 1, 1)..Date.new(current_year, 12, 31)
  Order.transaction do
    1000000.times do
      Order.create(created_at: dates_range.to_a.sample)
    end
  end
end
Don't expect this one to finish fast ;).
To get even better idea about the performance difference, we could also test the queries with different amount of data. After each benchmark we could create additional 250 000 records for each year and rerun benchmarks. This could be reapeated until we reach 2 mln records in each table (10 mln in total) so that way we would have data for 5 different orders' amount.
Benchmark methodology
To have a meaningful benchmark that can be applicable to some real-world app, we need to test the queries that are likely to happen. For that purpose we can try selecting all orders, orders from particular year, from several years, from past few months and we could also try finding some orders with random id. We should also limit the amount of records we return, well, unless we want to kill the local machine ;). Counting the amount of orders for different date ranges would also be a nice addition. For partitioned tables we could also throw in some additional benchmarks comparing the performance between selecting orders from given partitioned child table and from master table and letting the PostgreSQL figure out how to handle the query (i.e. using constraint exclusion for filtering tables).
In this case we don't really care about exact time for each query, but rather the ratio of query time (or iterations per seconds) for partitioned and not-partitioned table. Counting iterations per seconds for every query with banchmark-ips will be perfect for that. To calculate this ratio (let's call it Partioned To Not Partioned Ratio) we would just need to divide the result from partitioned table by the result from non-partitioned table.
The amount of data is quite an important factor for this benchmark, especially with comparison to some PostgreSQL config settings. The size of orders table for different amount is the following:
1,00 mln orders each -  5,00 mln total) - 249 MB
1,25 mln orders each -  6,25 mln total) - 311 MB
1,50 mln orders each -  7,50 mln total) - 373 MB
1,75 mln orders each -  8,75 mln total) - 436 MB
2,00 mln orders each - 10,00 mln total) - 498 MB
These are the most essential config settings on my local machine which were used during the benchmark:
shared_buffers = 128MB
temp_buffers = 8MB
work_mem = 4MB
maintenance_work_mem = 64MB
constraint_exclusion = partition
From our benchmark's perspective, shared_buffers and constraint_exclusion parameters are the crucial ones - shared_buffersdetermines how much memory can be used for caching tables and constraint_exclusion will prevent scanning all child tables if the query conditions make it clear it is not required.
Here's the final benchmark code, for patitioned tables:
require 'benchmark/ips'

Benchmark.ips do |x|
  x.config(time: 45, warmup: 2)

  x.report("select_all") { Order.limit(1000) }
  x.report("select_all_count") { Order.count }
  x.report("select_2016") { Order.where("created_at >= '2016-01-01' AND created_at <= '2016-12-31'").limit(1000) }
  x.report("select_2016_count") { Order.where("created_at >= '2016-01-01' AND created_at <= '2016-12-31'").count }
  x.report("select_2016_partitioned") {  Order.from_partition(Date.new(2016)).limit(1000) }
  x.report("select_2016_partitioned_count") {  Order.from_partition(Date.new(2016)).count }
  x.report("select_2018") { Order.where("created_at >= '2018-01-01' AND created_at <= '2018-12-31'").limit(1000) }
  x.report("select_2018_count") { Order.where("created_at >= '2018-01-01' AND created_at <= '2018-12-31'").count }
  x.report("select_2018_partitioned") { Order.from_partition(Date.new(2018)).limit(1000) }
  x.report("select_2018_partitioned_count") { Order.from_partition(Date.new(2018)).count }
  x.report("select_2020") { Order.where("created_at >= '2020-01-01' AND created_at <= '2020-12-31'").limit(100) }
  x.report("select_2020_count") { Order.where("created_at >= '2020-01-01' AND created_at <= '2020-12-31'").count }
  x.report("select_2020_partitioned") { Order.from_partition(Date.new(2020)).limit(1000) }
  x.report("select_2020_partitioned_count") { Order.from_partition(Date.new(2020)).count }
  x.report("select_2016_2019") { Order.where("created_at >= '2016-01-01' AND created_at <= '2019-12-31'").limit(1000) }
  x.report("select_2016_2019_count") { Order.where("created_at >= '2016-01-01' AND created_at <= '2019-12-31'").count }
  x.report("select_2018_2020") { Order.where("created_at >= '2018-01-01' AND created_at <= '2020-12-31'").limit(1000) }
  x.report("select_2018_2020_count") { Order.where("created_at >= '2018-01-01' AND created_at <= '2020-12-31'").count }
  x.report("select_last_3_months") { Order.where("created_at >= ?", 3.months.ago).limit(1000) }
  x.report("select_last_3_months_count") { Order.where("created_at >= ?", 3.months.ago).count }
  x.report("select_last_6_months") { Order.where("created_at >= ?", 6.months.ago).limit(1000) }
  x.report("select_last_6_months_count") { Order.where("created_at >= ?", 6.months.ago).count }
  x.report("select_random_order") { Order.find(rand(5000000)) }

  x.compare!
end
and for tables without partitioning:
require 'benchmark/ips'

Benchmark.ips do |x|
  x.config(time: 45, warmup: 2)

  x.report("select_all") { Order.limit(1000) }
  x.report("select_all_count") { Order.count }
  x.report("select_2016") { Order.where("created_at >= '2016-01-01' AND created_at <= '2016-12-31'").limit(1000) }
  x.report("select_2016_count") { Order.where("created_at >= '2016-01-01' AND created_at <= '2016-12-31'").count }
  x.report("select_2018") { Order.where("created_at >= '2018-01-01' AND created_at <= '2018-12-31'").limit(1000) }
  x.report("select_2018_count") { Order.where("created_at >= '2018-01-01' AND created_at <= '2018-12-31'").count }
  x.report("select_2020") { Order.where("created_at >= '2020-01-01' AND created_at <= '2020-12-31'").limit(100) }
  x.report("select_2020_count") { Order.where("created_at >= '2020-01-01' AND created_at <= '2020-12-31'").count }
  x.report("select_2016_2019") { Order.where("created_at >= '2016-01-01' AND created_at <= '2019-12-31'").limit(1000) }
  x.report("select_2016_2019_count") { Order.where("created_at >= '2016-01-01' AND created_at <= '2019-12-31'").count }
  x.report("select_2018_2020") { Order.where("created_at >= '2018-01-01' AND created_at <= '2020-12-31'").limit(1000) }
  x.report("select_2018_2020_count") { Order.where("created_at >= '2018-01-01' AND created_at <= '2020-12-31'").count }
  x.report("select_last_3_months") { Order.where("created_at >= ?", 3.months.ago).limit(1000) }
  x.report("select_last_3_months_count") { Order.where("created_at >= ?", 3.months.ago).count }
  x.report("select_last_6_months") { Order.where("created_at >= ?", 6.months.ago).limit(1000) }
  x.report("select_last_6_months_count") { Order.where("created_at >= ?", 6.months.ago).count }
  x.report("select_random_order") { Order.find(rand(5000000)) }

  x.compare!
end
Each operation will run for 45 seconds. We also need to include some warmup, otherwise the results would be less accurate.
Benchmark results
Here are the results of the benchmarks:
partitioned with 5 mln orders (1 mln orders per table)

Comparison:

select_all:                     74897.5 i/s
select_all_count:               1.9 i/s - 40047.58x slower
select_2016:                    44578.5 i/s - 1.68x slower
select_2016_count:              4.8 i/s - 15640.07x slower
select_2016_partitioned:        57904.0 i/s - 1.29x slower
select_2016_partitioned_count:  12.7 i/s - 5882.06x slower
select_2018:                    45989.3 i/s - 1.63x slower
select_2018_count:              4.9 i/s - 15263.65x slower
select_2018_partitioned:        58718.1 i/s - 1.28x slower
select_2018_partitioned_count:  13.7 i/s - 5475.04x slower
select_2020:                    49474.6 i/s - 1.51x slower
select_2020_count:              5.3 i/s - 14206.52x slower
select_2020_partitioned:        64135.2 i/s - 1.17x slower
select_2020_partitioned_count:  14.1 i/s - 5310.68x slower
select_2016_2019:               49829.4 i/s - 1.50x slower
select_2016_2019_count:         1.3 i/s - 58027.53x slower
select_2018_2020:               49869.1 i/s - 1.50x slower
select_2018_2020_count:         1.7 i/s - 43108.82x slower
select_last_3_months:           3904.2 i/s - 19.18x slower
select_last_3_months_count:     1.3 i/s - 55527.51x slower
select_last_6_months:           3909.1 i/s - 19.16x slower
select_last_6_months_count:     1.3 i/s - 56307.51x slower
select_random_order:            2629.8 i/s - 28.48x slower
no partitions with 5 mln orders

Comparison:
select_all:                   81600.5 i/s
select_all_count:             2.6 i/s - 31546.89x slower
select_2016:                  50899.1 i/s - 1.60x slower
select_2016_count:            2.4 i/s - 34118.71x slower
select_2018:                  49785.5 i/s - 1.64x slower
select_2018_count:            2.3 i/s - 35518.36x slower
select_2020:                  50353.3 i/s - 1.62x slower
select_2020_count:            2.2 i/s - 36477.64x slower
select_2016_2019:             50161.9 i/s - 1.63x slower
select_2016_2019_count:       1.2 i/s - 69940.19x slower
select_2018_2020:             50317.3 i/s - 1.62x slower
select_2018_2020_count:       1.4 i/s - 59057.02x slower
select_last_3_months:         3907.2 i/s - 20.88x slower
select_last_3_months_count:   1.5 i/s - 55355.65x slower
select_last_6_months:         3904.1 i/s - 20.90x slower
select_last_6_months_count:   1.5 i/s - 54201.25x slower
select_random_order:          2395.9 i/s - 34.06x slower
partitioned with 6,25 mln orders (1,25 mln orders per table)

Comparison:
select_all:                     73717.9 i/s
select_all_count:               1.4 i/s - 51747.39x slower
select_2016:                    44895.7 i/s - 1.64x slower
select_2016_count:              3.9 i/s - 19133.01x slower
select_2016_partitioned:        57672.1 i/s - 1.28x slower
select_2016_partitioned_count:  10.2 i/s - 7211.72x slower
select_2018:                    45076.8 i/s - 1.64x slower
select_2018_count:              3.7 i/s - 19909.78x slower
select_2018_partitioned:        57480.8 i/s - 1.28x slower
select_2018_partitioned_count:  10.3 i/s - 7177.85x slower
select_2020:                    44549.7 i/s - 1.65x slower
select_2020_count:              3.8 i/s - 19585.29x slower
select_2020_partitioned:        58816.4 i/s - 1.25x slower
select_2020_partitioned_count:  10.3 i/s - 7167.61x slower
select_2016_2019:               45154.9 i/s - 1.63x slower
select_2016_2019_count:         0.9 i/s - 78001.75x slower
select_2018_2020:               44243.8 i/s - 1.67x slower
select_2018_2020_count:         1.3 i/s - 57270.76x slower
select_last_3_months:           3607.3 i/s - 20.44x slower
select_last_3_months_count:     1.0 i/s - 72969.17x slower
select_last_6_months:           3650.9 i/s - 20.19x slower
select_last_6_months_count:     1.0 i/s - 73116.36x slower
select_random_order:            2734.6 i/s - 26.96x slower
no partitions with 6,25 mln orders

Comparison:
select_all:                    81474.7 i/s
select_all_count:              2.0 i/s - 40681.89x slower
select_2016:                   51134.3 i/s - 1.59x slower
select_2016_count:             4.8 i/s - 17008.37x slower
select_2018:                   51037.4 i/s - 1.60x slower
select_2018_count:             4.8 i/s - 16942.96x slower
select_2020:                   51078.8 i/s - 1.60x slower
select_2020_count:             4.8 i/s - 17054.96x slower
select_2016_2019:              50950.0 i/s - 1.60x slower
select_2016_2019_count:        0.9 i/s - 86364.33x slower
select_2018_2020:              50587.6 i/s - 1.61x slower
select_2018_2020_count:        1.1 i/s - 72926.49x slower
select_last_3_months:          3889.7 i/s - 20.95x slower
select_last_3_months_count:    1.2 i/s - 67447.88x slower
select_last_6_months:          3917.4 i/s - 20.80x slower
select_last_6_months_count:    1.2 i/s - 67757.10x slower
select_random_order:           3052.7 i/s - 26.69x slower
partitioned with 7,5 mln orders (1,5 mln orders per table)

Comparison:
select_all:                      73455.4 i/s
select_all_count:                1.2 i/s - 60875.32x slower
select_2016:                     45358.7 i/s - 1.62x slower
select_2016_count:               3.2 i/s - 23066.47x slower
select_2016_partitioned:         57730.7 i/s - 1.27x slower
select_2016_partitioned_count:   9.0 i/s - 8161.54x slower
select_2018:                     47094.5 i/s - 1.56x slower
select_2018_count:               3.3 i/s - 22478.03x slower
select_2018_partitioned:         59741.3 i/s - 1.23x slower
select_2018_partitioned_count:   8.9 i/s - 8289.60x slower
select_2020:                     46247.4 i/s - 1.59x slower
select_2020_count:               3.2 i/s - 23056.21x slower
select_2020_partitioned:         58764.7 i/s - 1.25x slower
select_2020_partitioned_count:   8.8 i/s - 8318.22x slower
select_2016_2019:                44424.4 i/s - 1.65x slower
select_2016_2019_count:          0.8 i/s - 94546.45x slower
select_2018_2020:                45202.2 i/s - 1.63x slower
select_2018_2020_count:          1.1 i/s - 68131.10x slower
select_last_3_months:            3530.4 i/s - 20.81x slower
select_last_3_months_count:      0.8 i/s - 89367.97x slower
select_last_6_months:            3473.7 i/s - 21.15x slower
select_last_6_months_count:      0.8 i/s - 92414.10x slower
select_random_order:             1224.6 i/s - 59.98x slower
no partitions with 7,5 mln orders


Comparison:
select_all:                   81357.1 i/s
select_all_count:             1.6 i/s - 52303.23x slower
select_2016:                  45865.5 i/s - 1.77x slower
select_2016_count:            3.8 i/s - 21673.22x slower
select_2018:                  49084.3 i/s - 1.66x slower
select_2018_count:            3.7 i/s - 21837.91x slower
select_2020:                  48963.7 i/s - 1.66x slower
select_2020_count:            3.8 i/s - 21364.75x slower
select_2016_2019:             49560.5 i/s - 1.64x slower
select_2016_2019_count:       0.7 i/s - 109331.83x slower
select_2018_2020:             47704.7 i/s - 1.71x slower
select_2018_2020_count:       0.8 i/s - 96387.27x slower
select_last_3_months:         3614.5 i/s - 22.51x slower
select_last_3_months_count:   0.9 i/s - 88464.34x slower
select_last_6_months:         3732.7 i/s - 21.80x slower
select_last_6_months_count:   0.9 i/s - 85721.04x slower
select_random_order:          2433.7 i/s - 33.43x slower
partitioned with 8,75 mln orders (1,75 mln orders per table)

Comparison:
select_all:                      69684.2 i/s
select_all_count:                1.0 i/s - 68219.96x slower
select_2016:                     44071.1 i/s - 1.58x slower
select_2016_count:               2.7 i/s - 26202.73x slower
select_2016_partitioned:         56547.4 i/s - 1.23x slower
select_2016_partitioned_count:   7.1 i/s - 9790.82x slower
select_2018:                     44275.5 i/s - 1.57x slower
select_2018_count:               2.8 i/s - 25299.18x slower
select_2018_partitioned:         59494.0 i/s - 1.17x slower
select_2018_partitioned_count:   7.8 i/s - 8963.99x slower
select_2020:                     48330.6 i/s - 1.44x slower
select_2020_count:               2.9 i/s - 24392.21x slower
select_2020_partitioned:         61583.6 i/s - 1.13x slower
select_2020_partitioned_count:   7.7 i/s - 9056.91x slower
select_2016_2019:                48135.1 i/s - 1.45x slower
select_2016_2019_count:          0.7 i/s - 100006.51x slower
select_2018_2020:                47873.0 i/s - 1.46x slower
select_2018_2020_count:          1.0 i/s - 72089.48x slower
select_last_3_months:            3789.7 i/s - 18.39x slower
select_last_3_months_count:      0.7 i/s - 93772.85x slower
select_last_6_months:            3743.8 i/s - 18.61x slower
select_last_6_months_count:      0.7 i/s - 104123.34x slower
select_random_order:             1594.8 i/s - 43.70x slower
no partitions with 8,75 mln orders

Comparison:
select_all:                    78650.3 i/s
select_all_count:              1.4 i/s - 57896.82x slower
select_2016:                   49334.2 i/s - 1.59x slower
select_2016_count:             2.8 i/s - 28319.15x slower
select_2018:                   49795.5 i/s - 1.58x slower
select_2018_count:             2.8 i/s - 27838.51x slower
select_2020:                   49627.9 i/s - 1.58x slower
select_2020_count:             2.9 i/s - 27517.70x slower
select_2016_2019:              50133.2 i/s - 1.57x slower
select_2016_2019_count:        0.7 i/s - 118255.69x slower
select_2018_2020:              49375.8 i/s - 1.59x slower
select_2018_2020_count:        0.7 i/s - 108822.92x slower
select_last_3_months:          3574.1 i/s - 22.01x slower
select_last_3_months_count:    0.8 i/s - 97753.55x slower
select_last_6_months:          3562.1 i/s - 22.08x slower
select_last_6_months_count:    0.8 i/s - 99605.90x slower
select_random_order:           3419.0 i/s - 23.00x slower
partitioned with 10 mln orders (2 mln orders per table)

Comparison:
select_all:                      73071.4 i/s
select_all_count:                0.9 i/s - 77393.87x slower
select_2016:                     46767.5 i/s - 1.56x slower
select_2016_count:               2.5 i/s - 29518.12x slower
select_2016_partitioned:         59404.4 i/s - 1.23x slower
select_2016_partitioned_count:   6.6 i/s - 11005.71x slower
select_2018:                     47674.2 i/s - 1.53x slower
select_2018_count:               2.4 i/s - 30309.30x slower
select_2018_partitioned:         58371.9 i/s - 1.25x slower
select_2018_partitioned_count:   6.5 i/s - 11256.61x slower
select_2020:                     46546.0 i/s - 1.57x slower
select_2020_count:               2.3 i/s - 31198.92x slower
select_2020_partitioned:         58862.7 i/s - 1.24x slower
select_2020_partitioned_count:   6.3 i/s - 11672.16x slower
select_2016_2019:                46781.4 i/s - 1.56x slower
select_2016_2019_count:          0.6 i/s - 122988.06x slower
select_2018_2020:                46147.2 i/s - 1.58x slower
select_2018_2020_count:          0.8 i/s - 90296.27x slower
select_last_3_months:            3699.8 i/s - 19.75x slower
select_last_3_months_count:      0.6 i/s - 116559.31x slower
select_last_6_months:            3716.8 i/s - 19.66x slower
select_last_6_months_count:      0.6 i/s - 121600.00x slower
select_random_order:             1548.6 i/s - 47.19x slower
no partitions with 10 mln orders

Comparison:
select_all:                    77376.3 i/s
select_all_count:              1.2 i/s - 66625.00x slower
select_2016:                   46285.5 i/s - 1.67x slower
select_2016_count:             2.3 i/s - 33061.51x slower
select_2018:                   47121.7 i/s - 1.64x slower
select_2018_count:             2.4 i/s - 32082.74x slower
select_2020:                   50322.0 i/s - 1.54x slower
select_2020_count:             2.5 i/s - 31443.35x slower
select_2016_2019:              48615.7 i/s - 1.59x slower
select_2016_2019_count:        0.6 i/s - 135045.30x slower
select_2018_2020:              49185.5 i/s - 1.57x slower
select_2018_2020_count:        0.7 i/s - 114814.42x slower
select_last_3_months:          3781.1 i/s - 20.46x slower
select_last_3_months_count:    0.7 i/s - 106257.71x slower
select_last_6_months:          3737.8 i/s - 20.70x slower
select_last_6_months_count:    0.7 i/s - 107643.07x slower
select_random_order:           3655.0 i/s - 21.17x slower
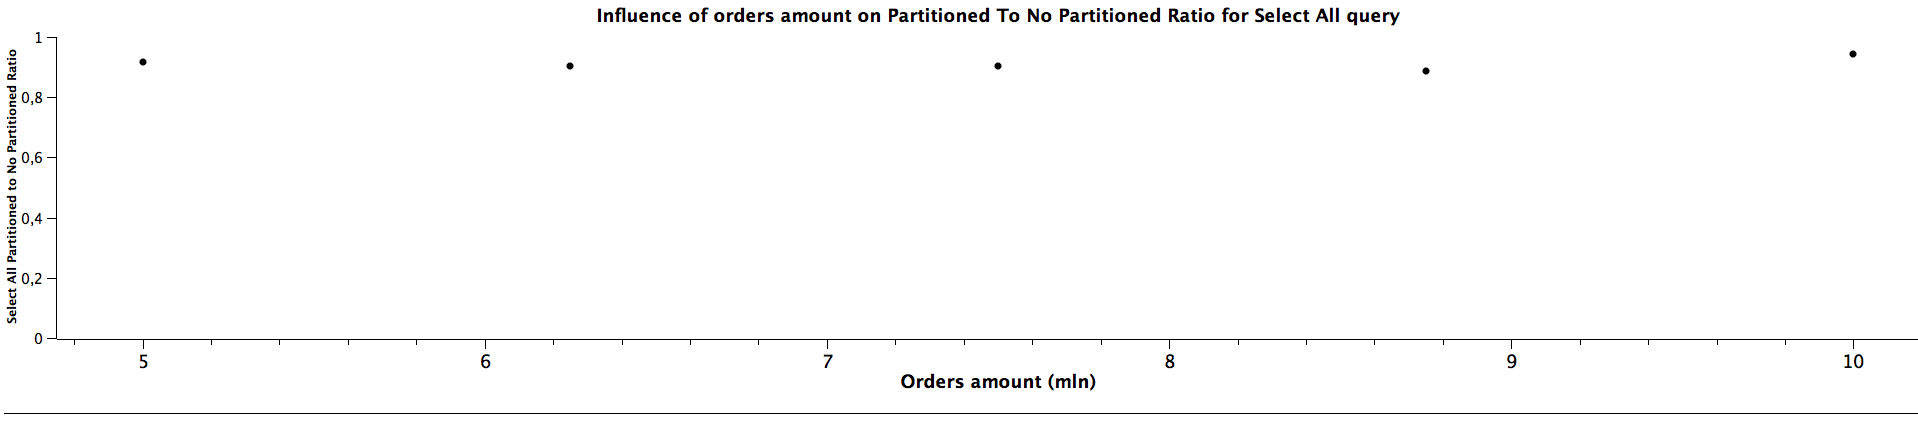
That way we've obtained iterations per second for different queries. Let's calculate now the ratio of query time for partitionied and not partitioned table. To get the better idea about the relation between the ratios for different orders' amount, I put the results on the graph (due to the proportions you may want to see them in better quality by clicking the link below each graph).
| Orders amount (mln) | Select All Partitioned To Not Partitioned Ratio |
|---------------------|-------------------------------------------------|
|        5,00         |                    0,917                        |
|        6,25         |                    0,905                        |
|        7,50         |                    0,903                        |
|        8,75         |                    0,886                        |
|       10,00         |                    0,944                        |
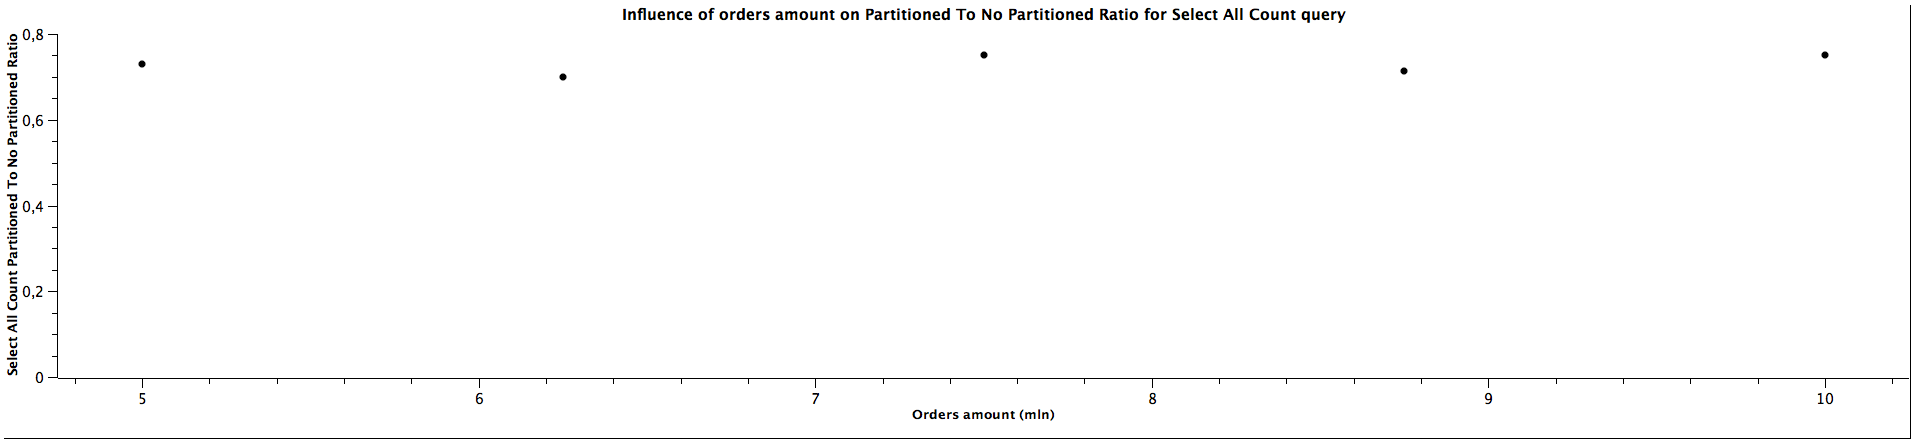
| Orders amount (mln) |  Select All Count Partitioned To Not Partitioned Ratio |
|---------------------|--------------------------------------------------------|
|        5,00         |                      0,731                             |
|        6,25         |                      0,700                             |
|        7,50         |                      0,750                             |
|        8,75         |                      0,714                             |
|       10,00         |                      0,750                             |
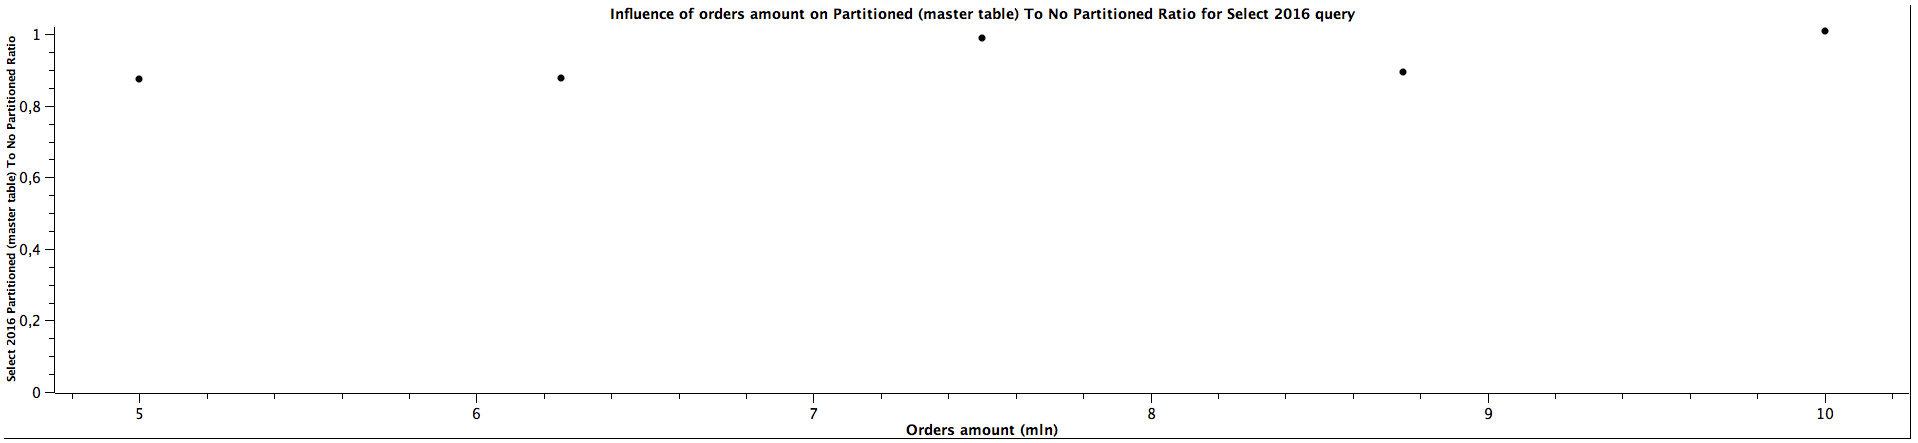
| Orders amount (mln) |  Select 2016 Partitioned (master table) To Not Partitioned Ratio |
|---------------------|------------------------------------------------------------------|
|        5,00         |                         0,876                                    |
|        6,25         |                         0,878                                    |
|        7,50         |                         0,989                                    |
|        8,75         |                         0,893                                    |
|       10,00         |                         1,010                                    |
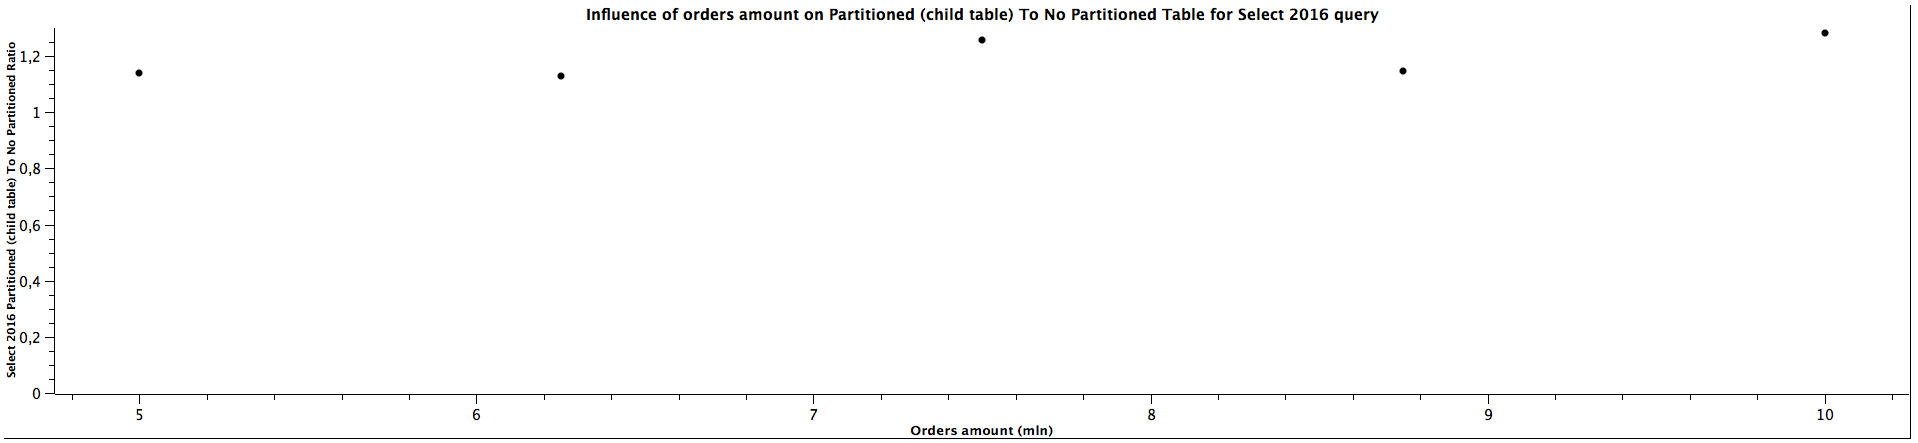
| Orders amount (mln) |  Select 2016 Partitioned (child table) To Not Partitioned Ratio  |
|---------------------|------------------------------------------------------------------|
|        5,00         |                         1,138                                    |
|        6,25         |                         1,128                                    |
|        7,50         |                         1,259                                    |
|        8,75         |                         1,146                                    |
|       10,00         |                         1,283                                    |
| Orders amount (mln) |  Select 2016 Partitioned (child table) To Master Table Ratio       |
|---------------------|--------------------------------------------------------------------|
|        5,00         |                         1,299                                      |
|        6,25         |                         1,285                                      |
|        7,50         |                         1,273                                      |
|        8,75         |                         1,283                                      |
|       10,00         |                         1,270                                      |

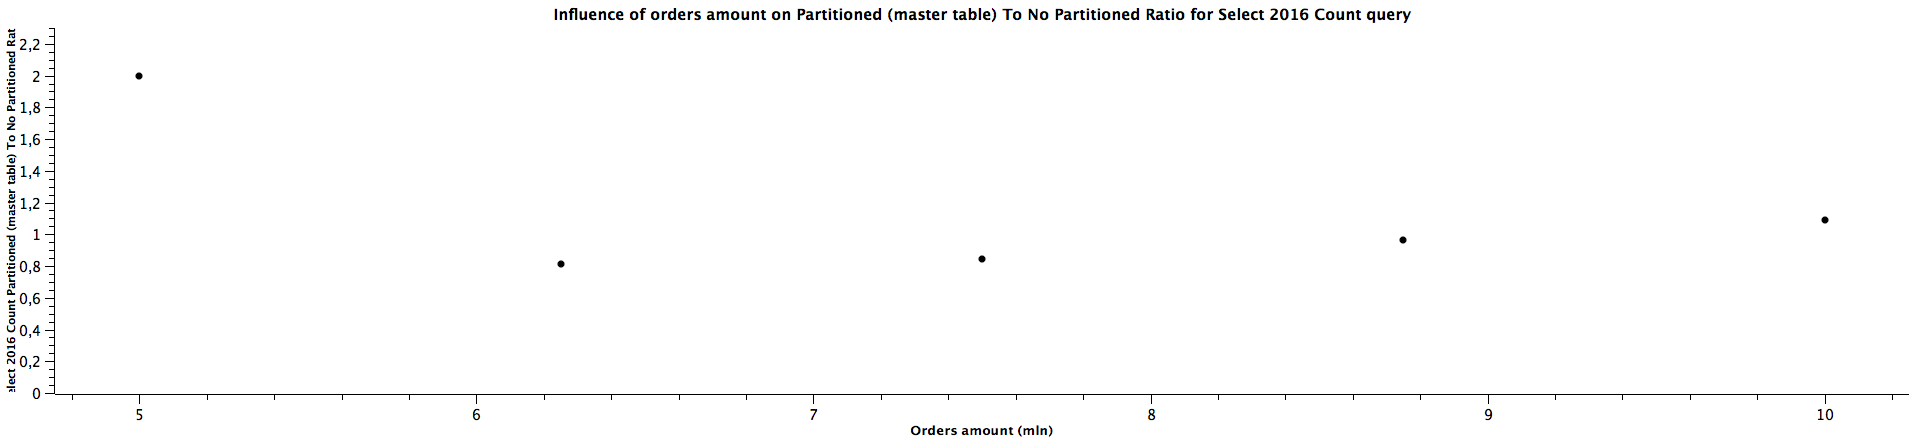
| Orders amount (mln) |  Select 2016 Count Partitioned (master table) To Not Partitioned Ratio |
|---------------------|------------------------------------------------------------------------|
|        5,00         |                            2,000                                       |
|        6,25         |                            0,813                                       |
|        7,50         |                            0,842                                       |
|        8,75         |                            0,964                                       |
|       10,00         |                            1,087                                       |
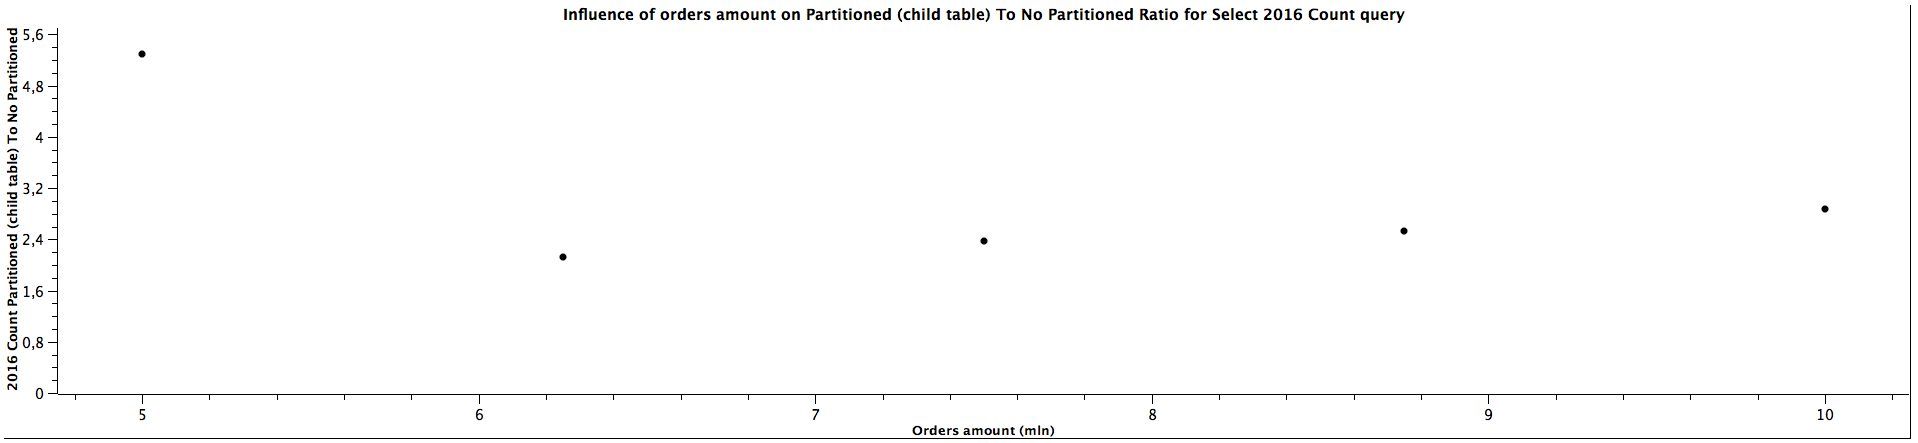
| Orders amount (mln) |  Select 2016 Count Partitioned (child table) To Not Partitioned Ratio |
|---------------------|-----------------------------------------------------------------------|
|        5,00         |                                5,292                                  |
|        6,25         |                                2,125                                  |
|        7,50         |                                2,368                                  |
|        8,75         |                                2,536                                  |
|       10,00         |                                2,870                                  |
| Orders amount (mln) |  Select 2016 Count Partitioned (child table) To Master Table Ratio |
|---------------------|--------------------------------------------------------------------|
|        5,00         |                               2,649                                |
|        6,25         |                               2,615                                |
|        7,50         |                               2,813                                |
|        8,75         |                               2,630                                |
|       10,00         |                               2,640                                |

| Orders amount (mln) |  Select 2018 Partitioned (master table) To Not Partitioned Ratio |
|---------------------|------------------------------------------------------------------|
|        5,00         |                          0,924                                   |
|        6,25         |                          0,883                                   |
|        7,50         |                          0,959                                   |
|        8,75         |                          0,889                                   |
|       10,00         |                          1,012                                   |
| Orders amount (mln) |  Select 2018 Partitioned (child table) To Not Partitioned Ratio |
|---------------------|-----------------------------------------------------------------|
|        5,00         |                           1,179                                 |
|        6,25         |                           1,126                                 |
|        7,50         |                           1,217                                 |
|        8,75         |                           1,195                                 |
|       10,00         |                           1,239                                 |
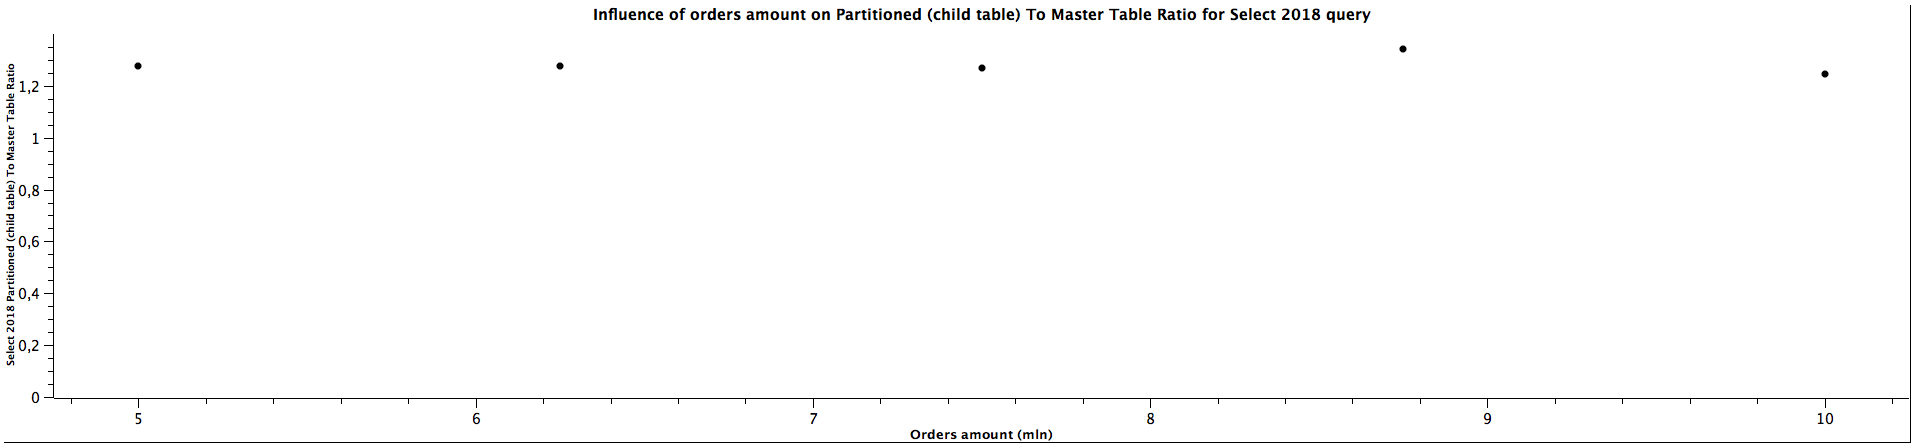
| Orders amount (mln) |  Select 2018 Partitioned (child table) To Master Table Ratio |
|---------------------|--------------------------------------------------------------|
|        5,00         |                           1,277                              |
|        6,25         |                           1,275                              |
|        7,50         |                           1,269                              |
|        8,75         |                           1,344                              |
|       10,00         |                           1,244                              |
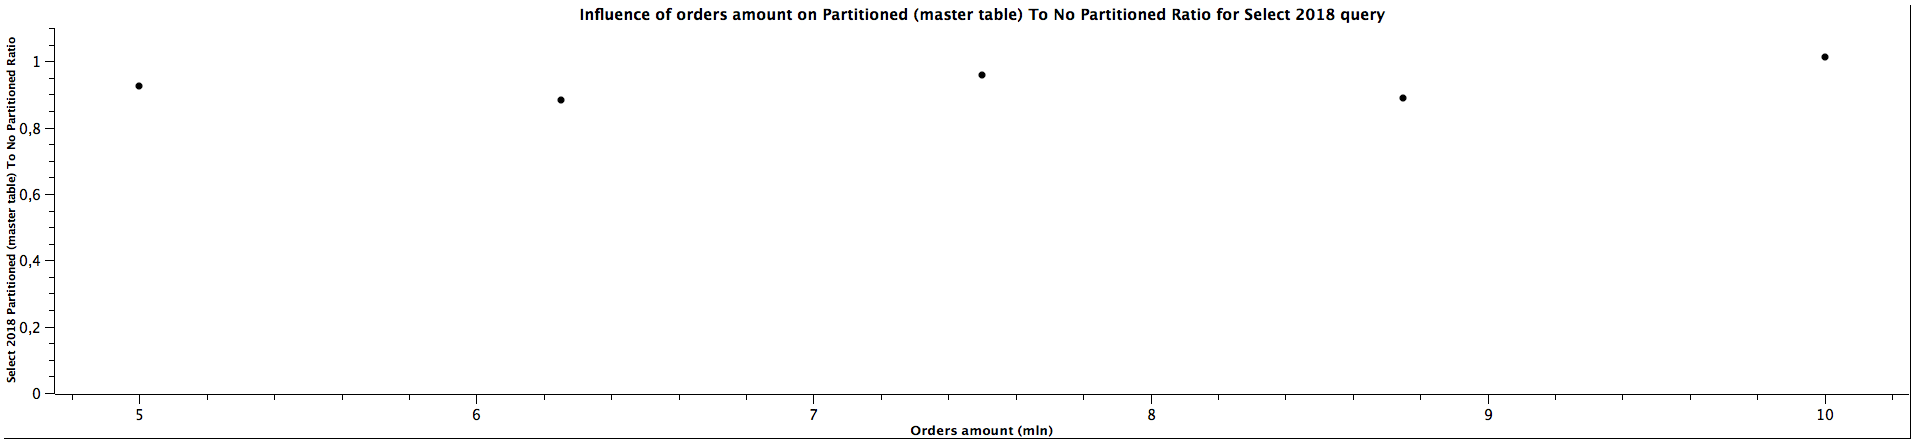
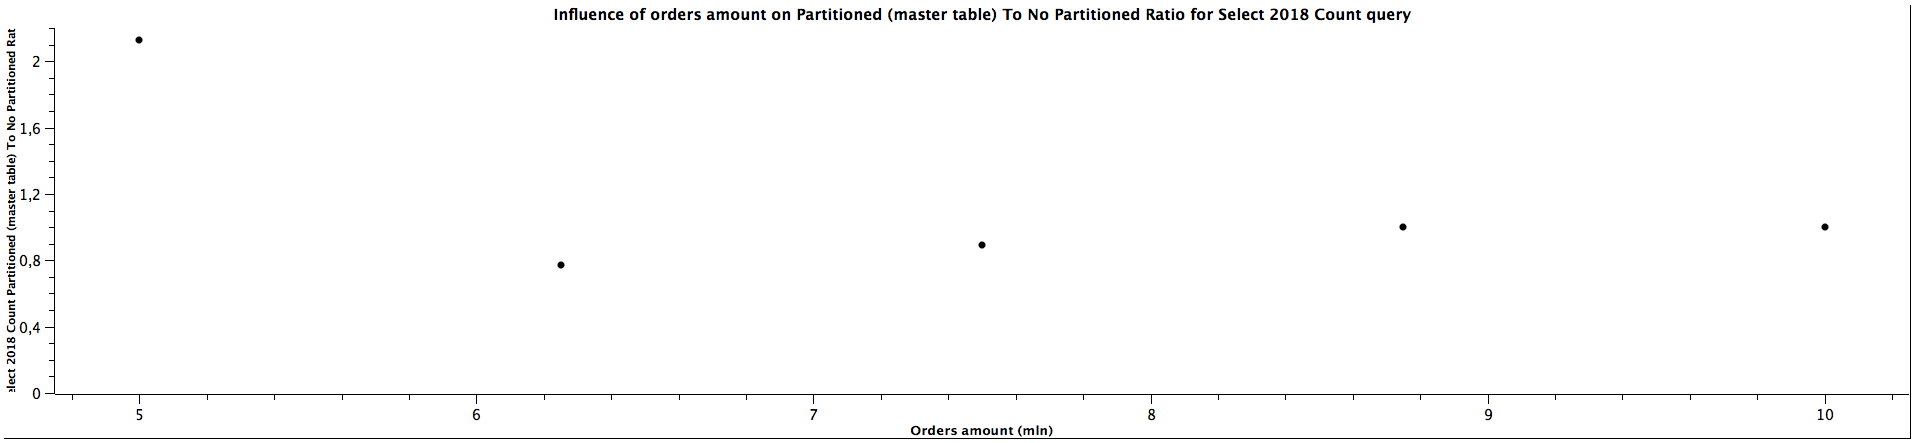
| Orders amount (mln) |  Select 2018 Count Partitioned (master table) To Not Partitioned Ratio |
|---------------------|------------------------------------------------------------------------|
|        5,00         |                            2,130                                       |
|        6,25         |                            0,771                                       |
|        7,50         |                            0,892                                       |
|        8,75         |                            1,000                                       |
|       10,00         |                            1,000                                       |
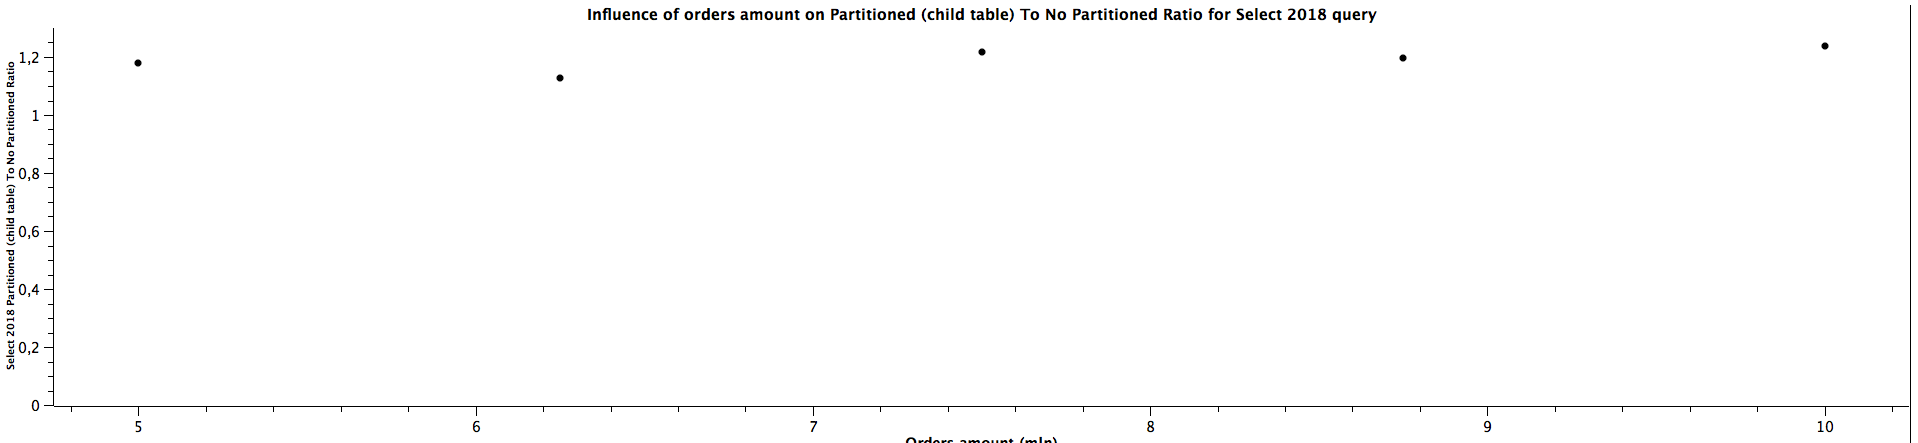
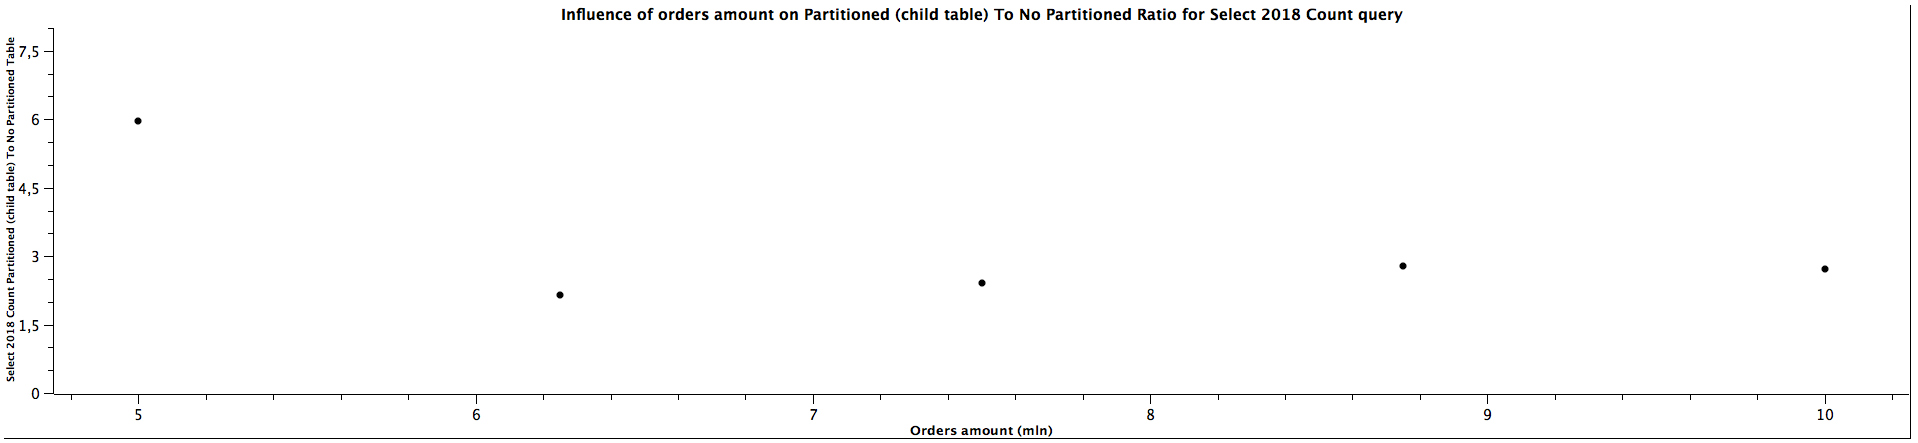
| Orders amount (mln) |  Select 2018 Count Partitioned (child table) To Not Partitioned Ratio |
|---------------------|-----------------------------------------------------------------------|
|        5,00         |                           5,957                                       |
|        6,25         |                           2,146                                       |
|        7,50         |                           2,405                                       |
|        8,75         |                           2,786                                       |
|       10,00         |                           2,708                                       |
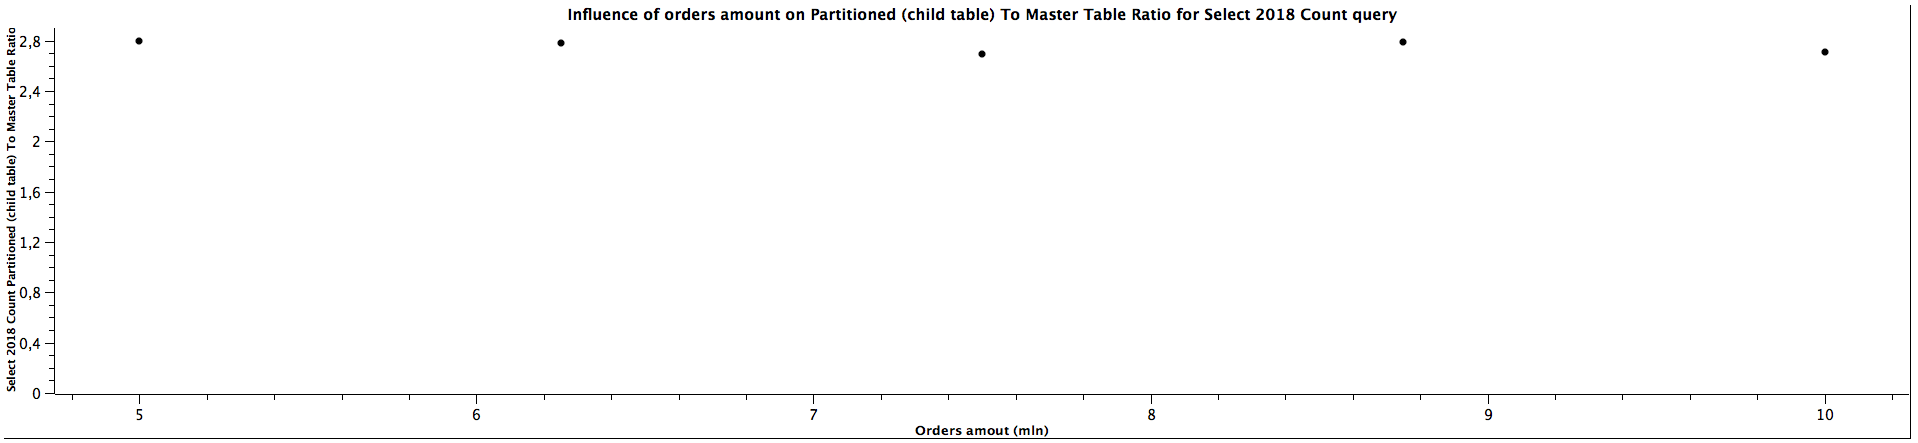
| Orders amount (mln) |  Select 2018 Count Partitioned (child table) To Master Table Ratio |
|---------------------|--------------------------------------------------------------------|
|        5,00         |                              2,796                                 |
|        6,25         |                              2,784                                 |
|        7,50         |                              2,697                                 |
|        8,75         |                              2,786                                 |
|       10,00         |                              2,708                                 |
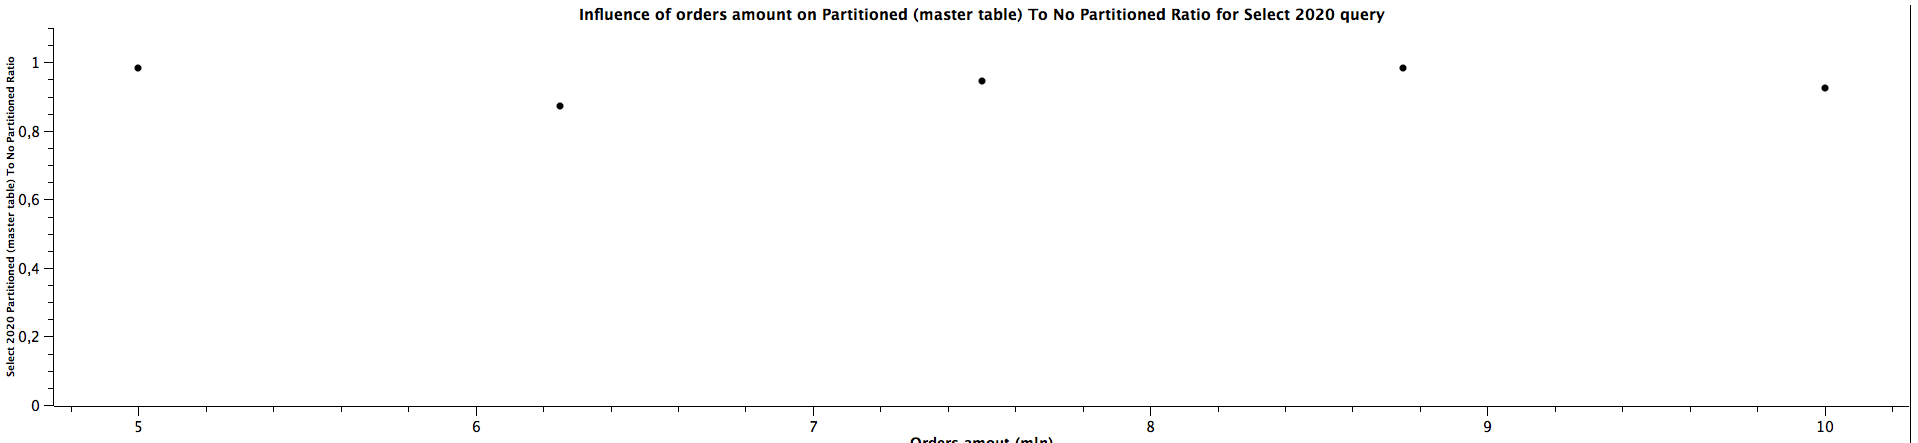
| Orders amount (mln) |  Select 2020 Partitioned (master tables) To Not Partitioned Ratio |
|---------------------|-------------------------------------------------------------------|
|        5,00         |                            0,983                                  |
|        6,25         |                            0,873                                  |
|        7,50         |                            0,945                                  |
|        8,75         |                            0,984                                  |
|       10,00         |                            0,925                                  |
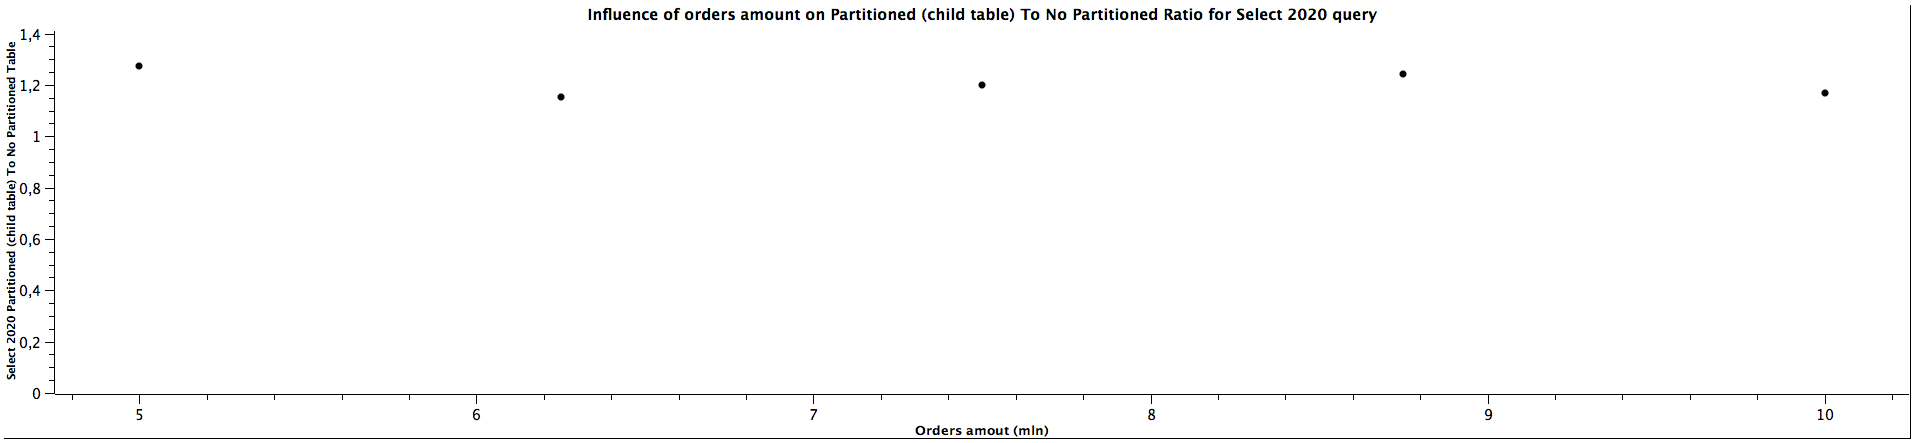
| Orders amount (mln) |  Select 2020 Partitioned (child table) To Not Partitioned Ratio |
|---------------------|-----------------------------------------------------------------|
|        5,00         |                             1,274                               |
|        6,25         |                             1,151                               |
|        7,50         |                             1,200                               |
|        8,75         |                             1,241                               |
|       10,00         |                             1,170                               |
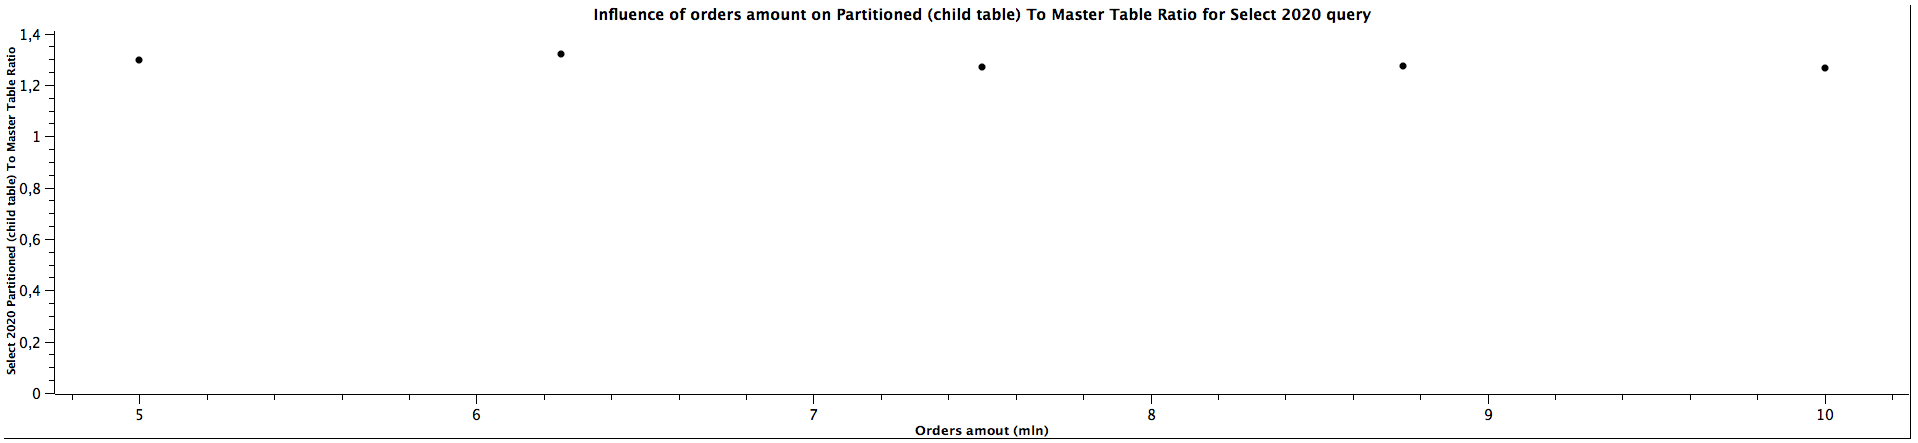
| Orders amount (mln) |  Select 2020 Partitioned (child table) To Master Table Ratio |
|---------------------|--------------------------------------------------------------|
|        5,00         |                            1,296                             |
|        6,25         |                            1,320                             |
|        7,50         |                            1,270                             |
|        8,75         |                            1,274                             |
|       10,00         |                            1,265                             |
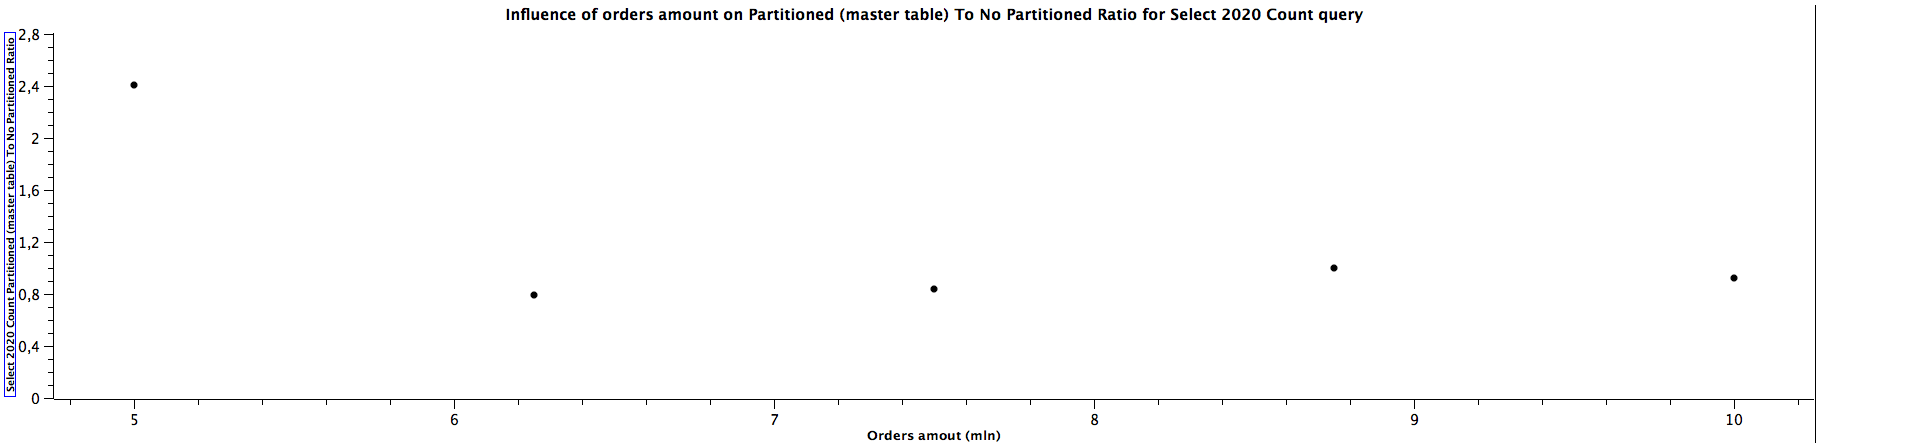
| Orders amount (mln) |  Select 2020 Count Partitioned (master table) To Not Partitioned Ratio |
|---------------------|------------------------------------------------------------------------|
|        5,00         |                            2,409                                       |
|        6,25         |                            0,792                                       |
|        7,50         |                            0,842                                       |
|        8,75         |                            1,000                                       |
|       10,00         |                            0,920                                       |
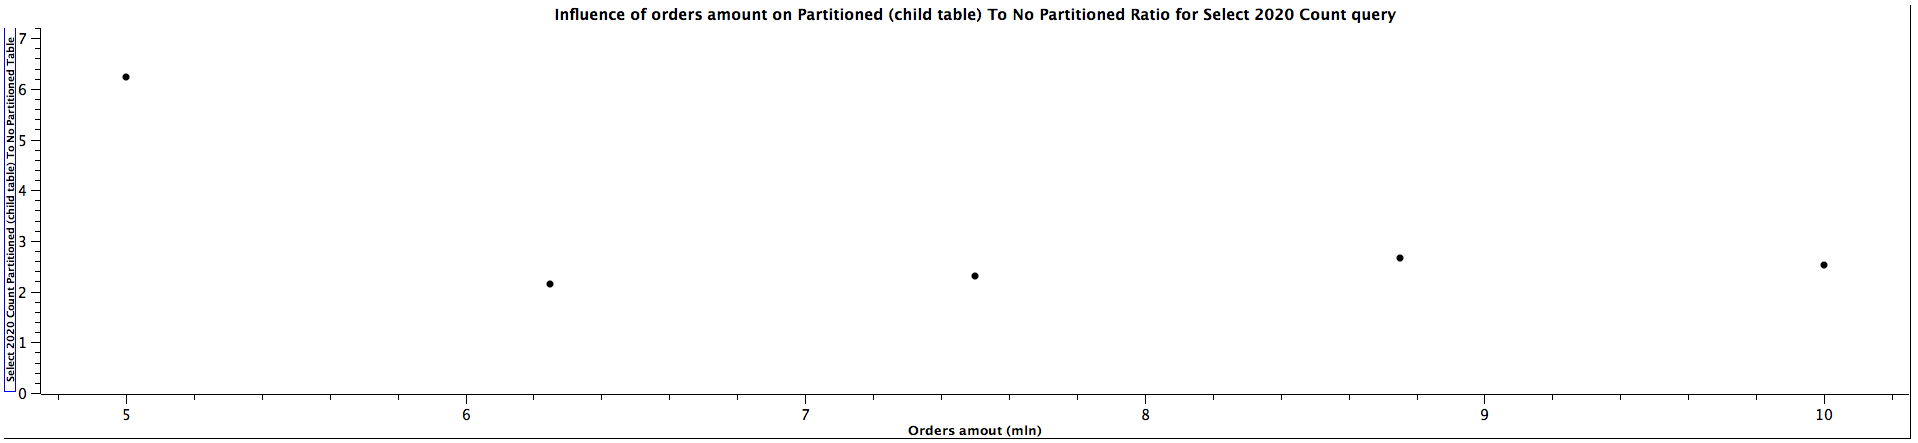
| Orders amount (mln) |  Select 2020 Count Partitioned (child table) To Not Partitioned Ratio |
|---------------------|-----------------------------------------------------------------------|
|        5,00         |                               6,227                                   |
|        6,25         |                               2,146                                   |
|        7,50         |                               2,316                                   |
|        8,75         |                               2,656                                   |
|       10,00         |                               2,520                                   |
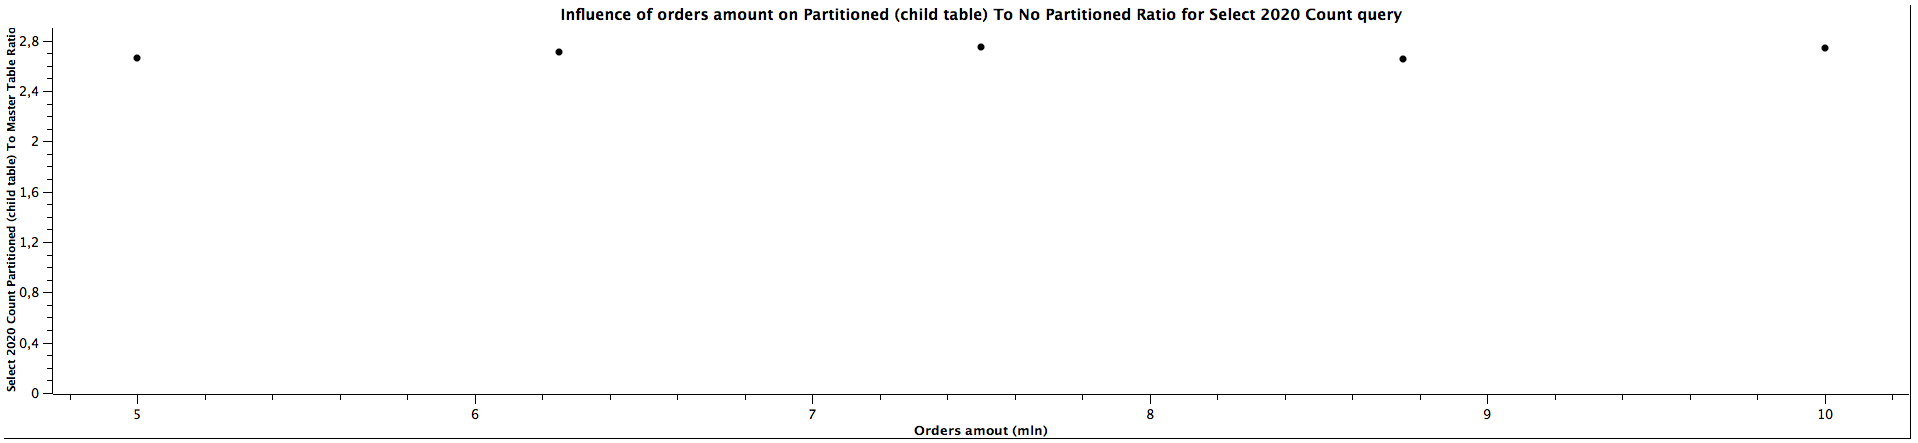
| Orders amount (mln) |  Select 2020 Count Partitioned (child table) To Master Table Ratio |
|---------------------|--------------------------------------------------------------------|
|        5,00         |                              2,660                                 |
|        6,25         |                              2,711                                 |
|        7,50         |                              2,750                                 |
|        8,75         |                              2,656                                 |
|       10,00         |                              2,739                                 |
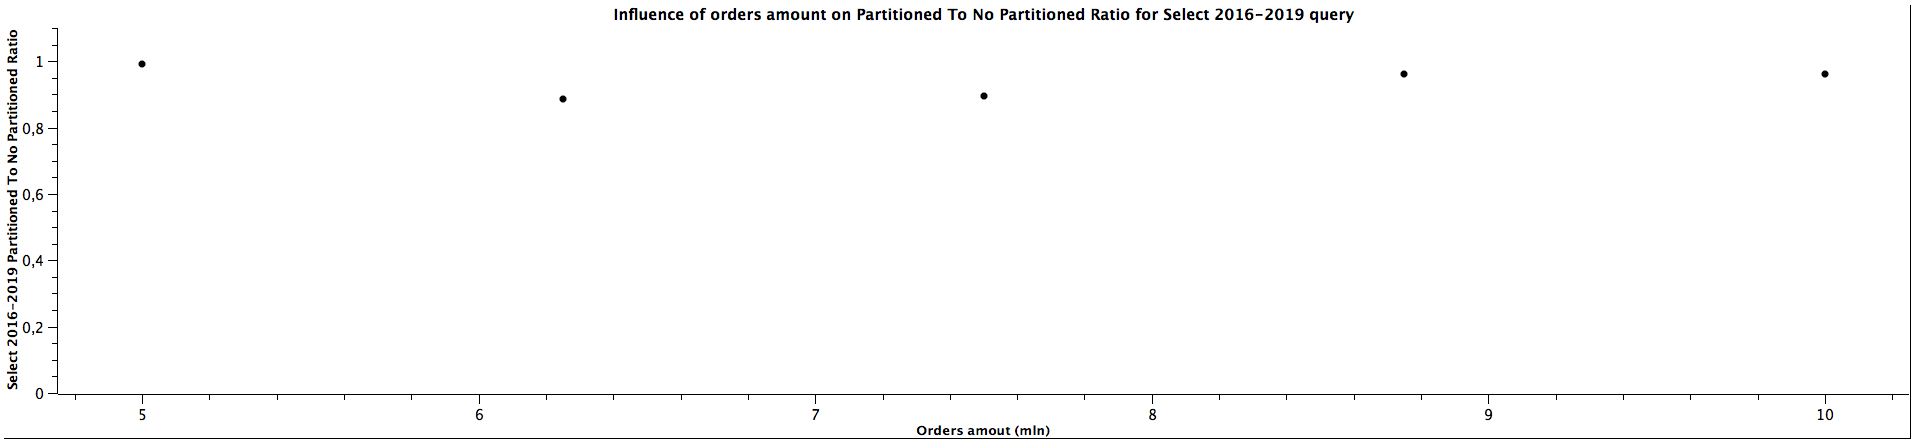
| Orders amount (mln) |  Select 2016-2019 Partitioned To Not Partitioned Ratio |
|---------------------|--------------------------------------------------------|
|        5,00         |                       0,993                            |
|        6,25         |                       0,886                            |
|        7,50         |                       0,896                            |
|        8,75         |                       0,960                            |
|       10,00         |                       0,962                            |
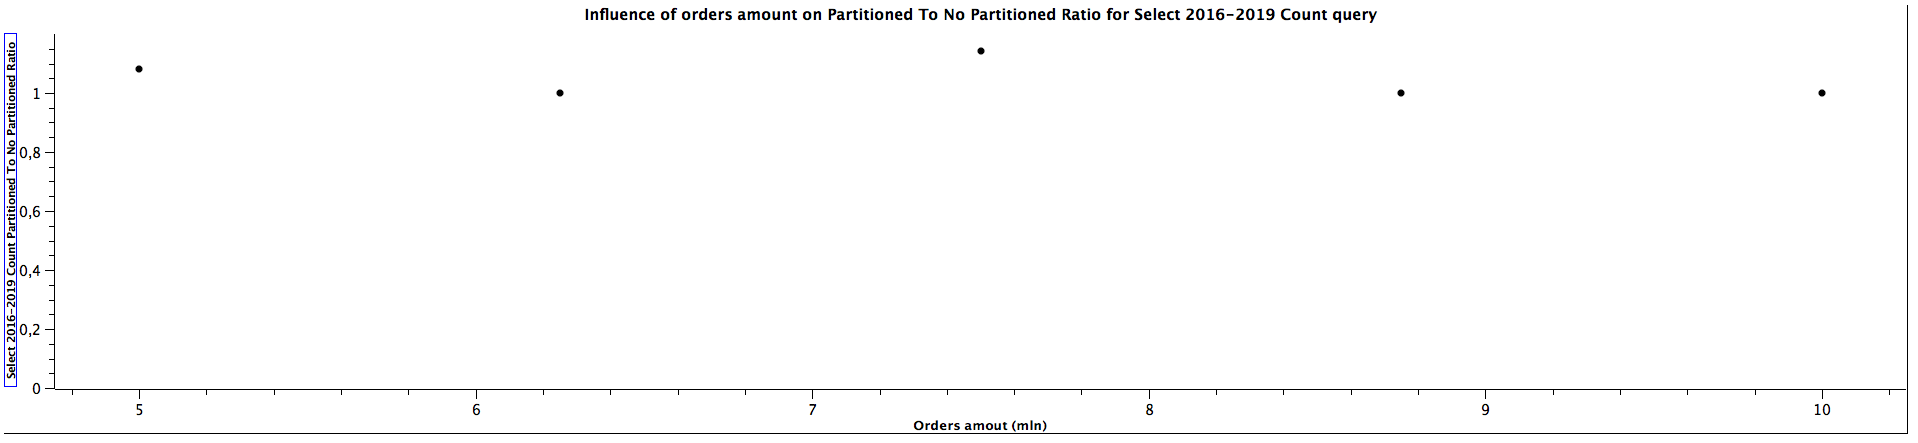
| Orders amount (mln) |  Select 2016-2019 Count Partitioned To Not Partitioned Ratio |
|---------------------|--------------------------------------------------------------|
|        5,00         |                            1,083                             |
|        6,25         |                            1,000                             |
|        7,50         |                            1,143                             |
|        8,75         |                            1,000                             |
|       10,00         |                            1,000                             |
| Orders amount (mln) |  Select 2018-2020 Partitioned To Not Partitioned Ratio           |
|---------------------|------------------------------------------------------------------|
|        5,00         |                          0,991                                   |
|        6,25         |                          0,875                                   |
|        7,50         |                          0,948                                   |
|        8,75         |                          0,970                                   |
|       10,00         |                          0,938                                   |

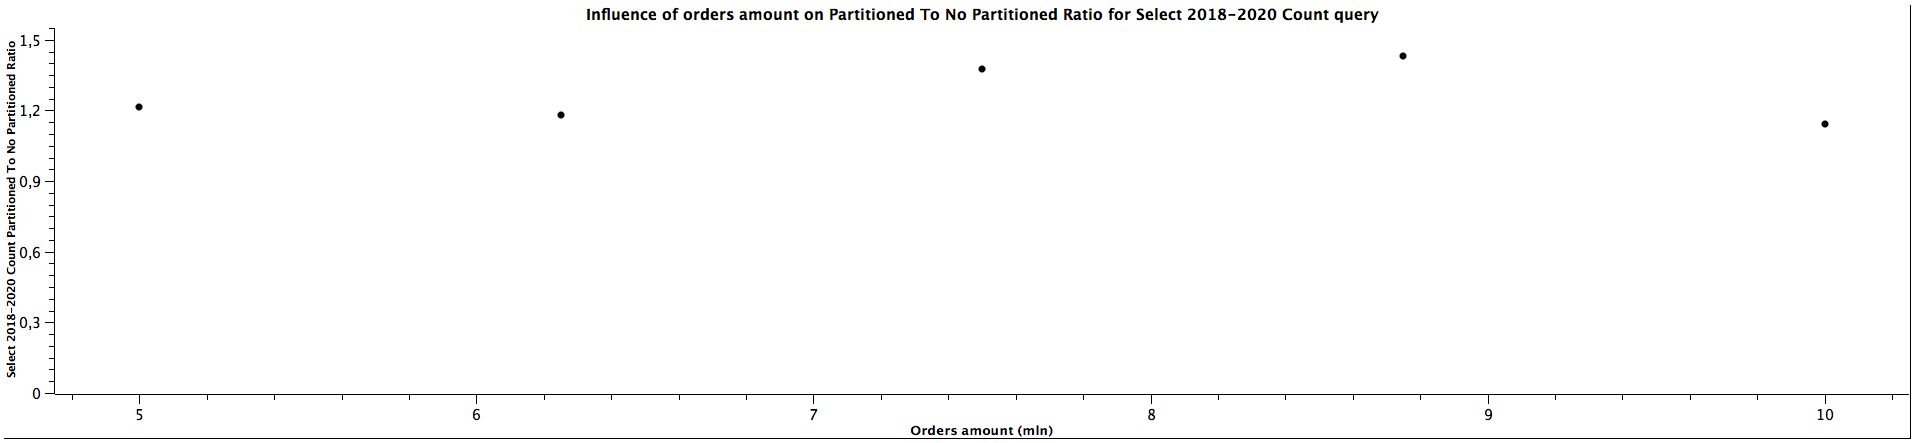
| Orders amount (mln) |  Select 2018-2020 Count Partitioned To Not Partitioned Ratio |
|---------------------|--------------------------------------------------------------|
|        5,00         |                          1,214                               |
|        6,25         |                          1,182                               |
|        7,50         |                          1,375                               |
|        8,75         |                          1,429                               |
|       10,00         |                          1,143                               |
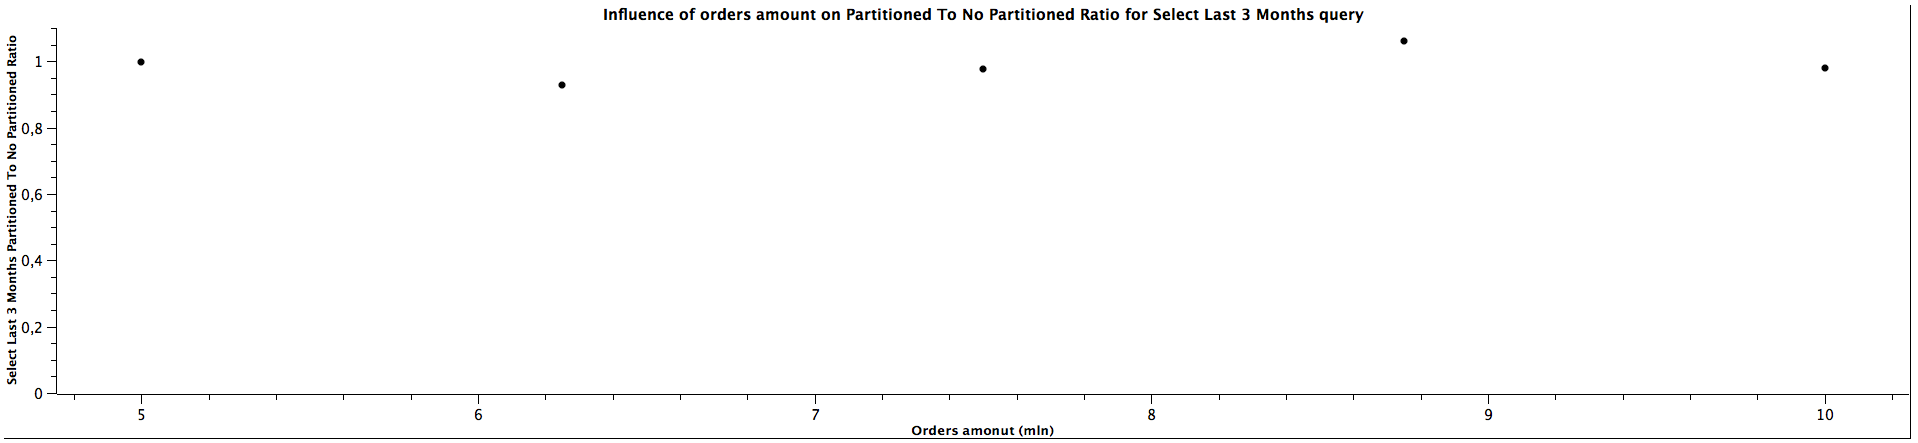
| Orders amount (mln) |  Select Last 3 Months Partitioned To Not Partitioned Ratio |
|---------------------|------------------------------------------------------------|
|        5,00         |                            0,999                           |
|        6,25         |                            0,927                           |
|        7,50         |                            0,977                           |
|        8,75         |                            1,060                           |
|       10,00         |                            0,978                           |
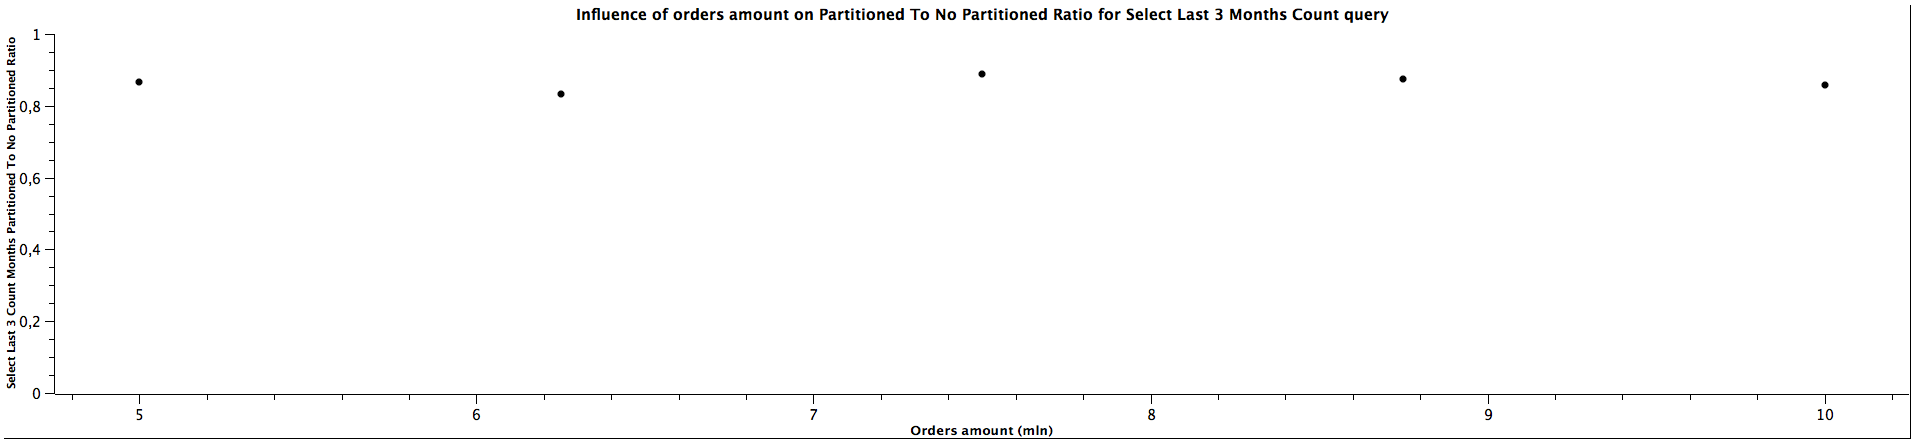
| Orders amount (mln) |  Select Last 3 Months Count Partitioned To Not Partitioned Ratio |
|---------------------|------------------------------------------------------------------|
|        5,00         |                            0,867                                 |
|        6,25         |                            0,833                                 |
|        7,50         |                            0,889                                 |
|        8,75         |                            0,875                                 |
|       10,00         |                            0,857                                 |
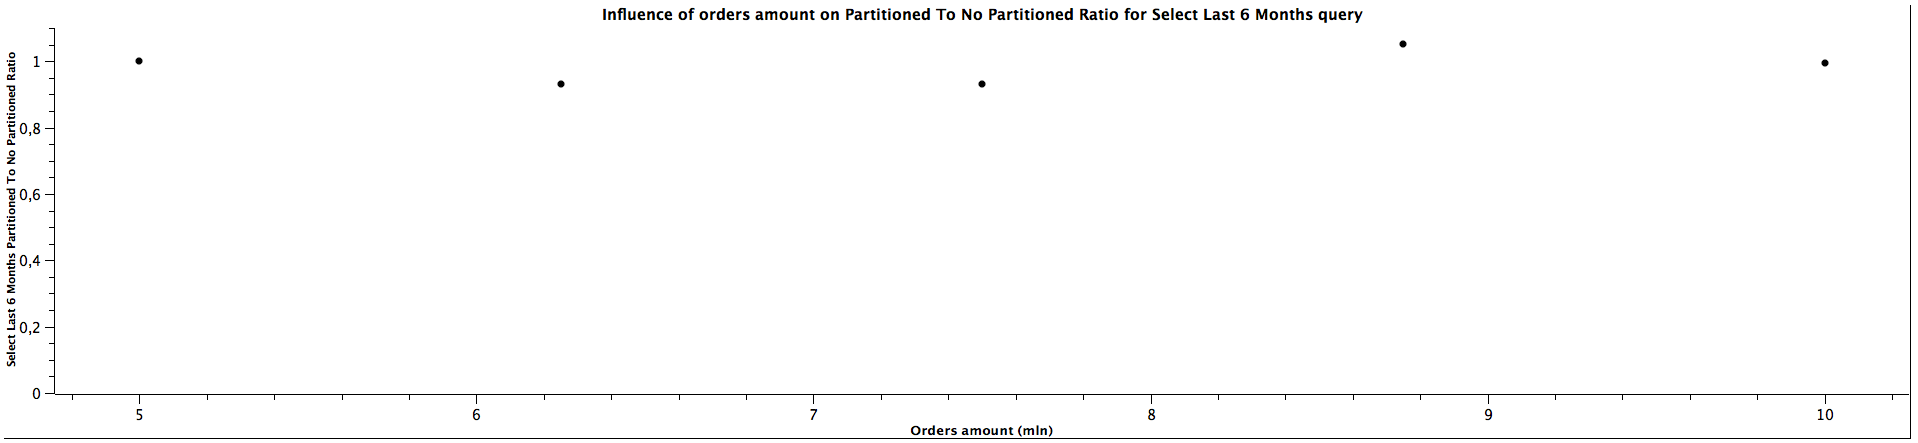
| Orders amount (mln) |  Select Last 6 Months Partitioned To Not Partitioned Ratio |
|---------------------|------------------------------------------------------------|
|        5,00         |                         1,001                              |
|        6,25         |                         0,932                              |
|        7,50         |                         0,931                              |
|        8,75         |                         1,051                              |
|       10,00         |                         0,994                              |
| Orders amount (mln) |  Select Last 6 Months Count Partitioned To Not Partitioned Ratio |
|---------------------|------------------------------------------------------------------|
|        5,00         |                          0,867                                   |
|        6,25         |                          0,833                                   |
|        7,50         |                          0,889                                   |
|        8,75         |                          0,875                                   |
|       10,00         |                          0,857                                   |

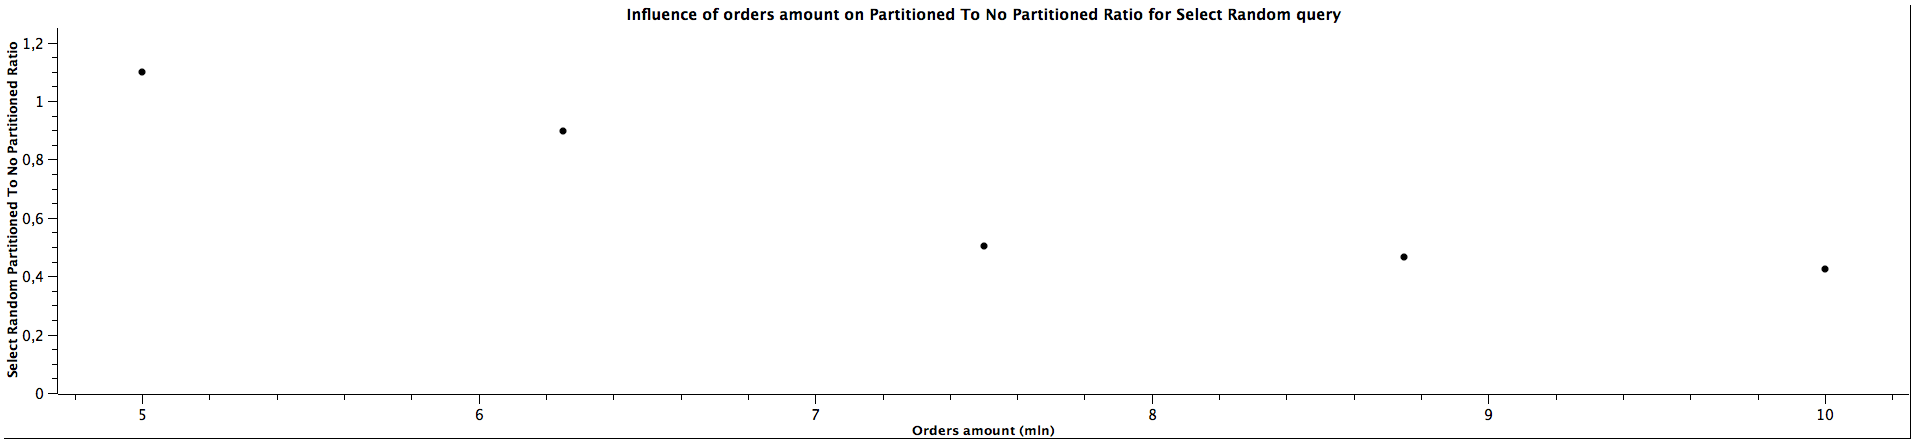
| Orders amount (mln) |  Select Random Partitioned To Not Partitioned Ratio |
|---------------------|-----------------------------------------------------|
|        5,00         |                          1,098                      |
|        6,25         |                          0,896                      |
|        7,50         |                          0,503                      |
|        8,75         |                          0,466                      |
|       10,00         |                          0,424                      |
Let's break down these benchmarks to several groups:
For selecting all records and counting them the obvious conclusion is that for partitioned tables the queries are slower: slightly slower for just selecting them and noticeably slower for counting them. For selecting all orders, the ratio of partitioned to not partitioned tables query times most likely decreases as the tables' size grow and for counting it is not clear: the data doesn't show any regular correlation, we could expect the ratio would also decrease for the larger amount of data, however, we can't really tell based on this benchmark, which even suggests it could be a constant value. Nevertheless, table partitioning isn't the best idea if the queries are primarily run across all the tables.
The results for selecting orders (queries for orders from years: 2016, 2018, 2020) only from specific date range which matches the constraints for children partitioned tabled look quite interesting: The more records we have, the better ratio (in favour of table of partitioning) we get. Table partitioning doesn't always yield better results when the child table is not specified (see: Partitioned (master table) To Not Partitioned Ratio), but there's a certain size of the tables when we get the ratio above 1, which means queries for partitioned tables (even without specifying a child table) are faster. When selecting from partitioned child table (see: Partitioned (child table) To Not Partitioned Ratio) the queries are faster for partitioned tables regardless of the size, which was expected. Depending on the size of the table, the difference can be quite significant, up to 28%. The data is not clear enough to be certain about the correlation with amount of orders / table size (substantial irregularity for orders from years 2020), but probably the bigger the tables are, the bigger difference of query time between partitioned and not partitioned tables, similarly to the case when the child table is not specified. The difference between explicitly running queries against a specific child table and running against a master table and relying on constraints exclusion it quite surprising: I was expecting only a slight difference, however, specifying a child table can make the queries up to 35% faster. There is a possibility this difference decreases slowly the more records there are in the tables, however, we would need more benchmarks to prove or disprove this hypothesis as there is another possibility of having costant ratio.
The general correlation for counting the records which can be put in the specific partitioned child tables is the same as for selecting the orders: the more records in the tables, the better performance table partitioning yields. When the child table is not specified, counting records can be faster for not partitioned tables until we reach a certain size where table partitioning seems to be a better choice performance-wise. For counting orders from all the years (2016, 2018, 2020) for 5 mln orders, the ratios are significantly different comparing to the values for higher amount of orders, which can't be easily explained. It's quite interesting that it happened for the queries for all the tables used in the benchmark, which might be worth investigating further, however, I would treat them as irrelevant in this case and not consider them at all. When the partitioned table is specified, the results are always better in favour of table partitioning - we can expect queries to be more than 2 times faster, even up to almost 3 times faster. Similarly to selecting the orders, the ratio of running queries against child table and master table is either a constant or slightly decreases as the amount of orders grows.
For selecting records form multiple children tables, the Partioned To Not Partitioned Ratio is lower than 1, which means that table partitioning would be a inferior choice for such queries, regardless of the size. However, the difference is not that significant. On the other hand, for counting the records it looks like table partitioning yields better performance, which is especially clear for 2018-2020 range, but we can't tell what's the correlation with the amount of orders based on the obtained results.
The performance for selecting records from last N months (here 3 and 6 accordingly) is quite similar for both partitioned and not partitioned strategies (ratio close to 1), which doesn't change when the amount of orders grows. However, counting records is significantly slower, but the ratio most likely remains constant as the table gets bigger.
Initially, there seems to be no difference in query time between selecting orders from partitioned and not-partitioned table, but as the amount of orders grows, the performance keeps getting worse considerably, which is expected as the constraints exclusion can't be applied in such case.
To sum up:
- The larger amount of records, the better performance table partitioning yields
- Table partitioning is not optimal for all type of queries, it should be mostly used when querying only a subset of records covered by a particular child table
- Specifying exact child table yields much better peformance than querying master table and relying on constraint exclusion
Wrapping up
Even though table partitioning requires some extra overhead and may be tricky to get started with, it is clear that the performance benefits of using it may outweight the costs when applying to the right queries. However, we need to be aware that it is not the perfect choice for all the queries and in some cases it can deteriorate the performance.